
真皮が持つ再生能力について様々な角度から動物実験が実施されました
See this image and copyright information in PMC
Figure 1 Tissue fragments in micrografted skin solution. (A) Normal skin tissue was minced by Rigeneracons®. Obtained tissues were stained with HE and observed under a microscope; (B) Obtained tissue was also stained with Masson’s trichrome (MT), which contained all of the skin elements, including epithelial cells, hair roots, vessels, glandular cells, muscle cells and mononuclear cells. Connective tissue is also included. Scale bars = 50 μm.Figure 1 Tissue fragments in micrografted skin solution. (A) Normal skin tissue was minced by Rigeneracons®. Obtained tissues were stained with HE and observed under a microscope; (B) Obtained tissue was also stained with Masson’s trichrome (MT), which contained all of the skin elements, including epithelial cells, hair roots, vessels, glandular cells, muscle cells and mononuclear cells. Connective tissue is also included. Scale bars = 50 μm.
Figure 1 Tissue fragments in micrografted skin solution. (A) Normal skin tissue was minced by Rigeneracons®. Obtained tissues were stained with HE and observed under a microscope; (B) Obtained tissue was also stained with Masson’s trichrome (MT), which contained all of the skin elements, including epithelial cells, hair roots, vessels, glandular cells, muscle cells and mononuclear cells. Connective tissue is also included. Scale bars = 50 μm.
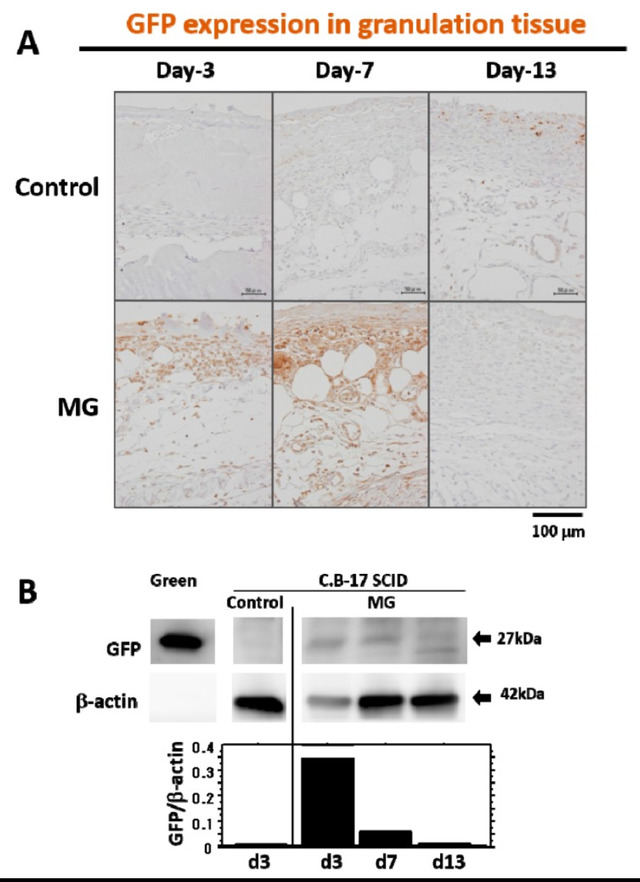
Figure 2 GFP expression in granulation tissue after wounding. (A) Presence of GFP in granulation tissue developed after wounding was immunohistochemically detected in immune-deficient SCID mice with micrograft of skin tissue solution from GFP-positive green mouse or saline alone (control) on Days 3, 7and 13. Photographs are representative wounds in each group. Scale bars = 100 μm; (B) Western blot analysis for GFP in granulation tissue was performed in SCID mice with micrograft of skin tissue solution solution green mouse or saline alone (control) on Days 3, 7 and 13. Green mice were used as a positive control. Densitometry analysis of GFP and β-actin was also conducted; relative expression value of GFP is shown in the bar graph. from green mouse or saline alone (control) on Days 3, 7 and 13. Green mice were used as a positive control. Densitometry analysis of GFP and β-actin was also conducted; relative expression value of GFP is shown in the bar graph.